The 11 figures from From Plunder to Plenty, with the captions and sources as they appear in the book, followed by the art that opens each chapter. Download everything as a PDF.
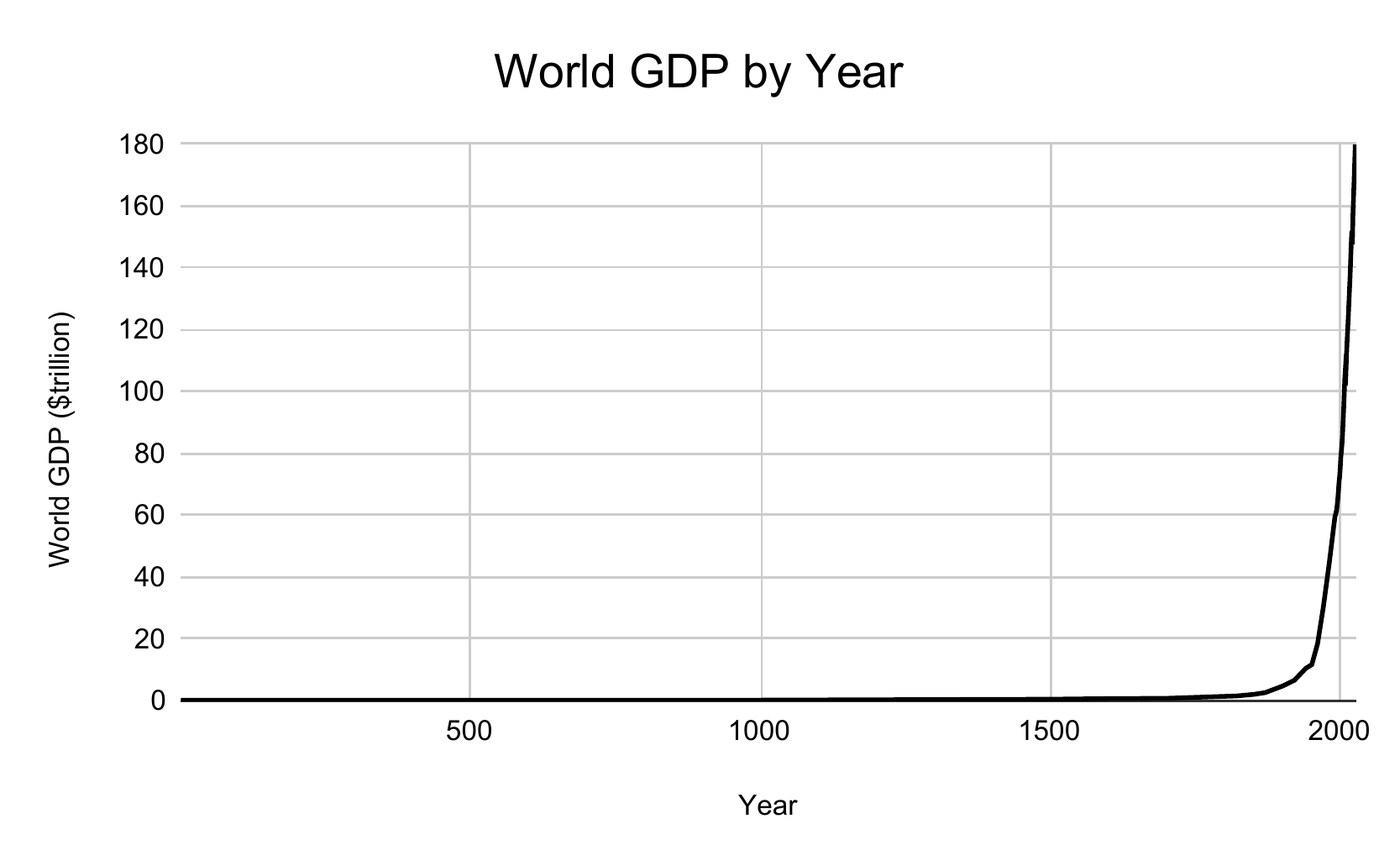
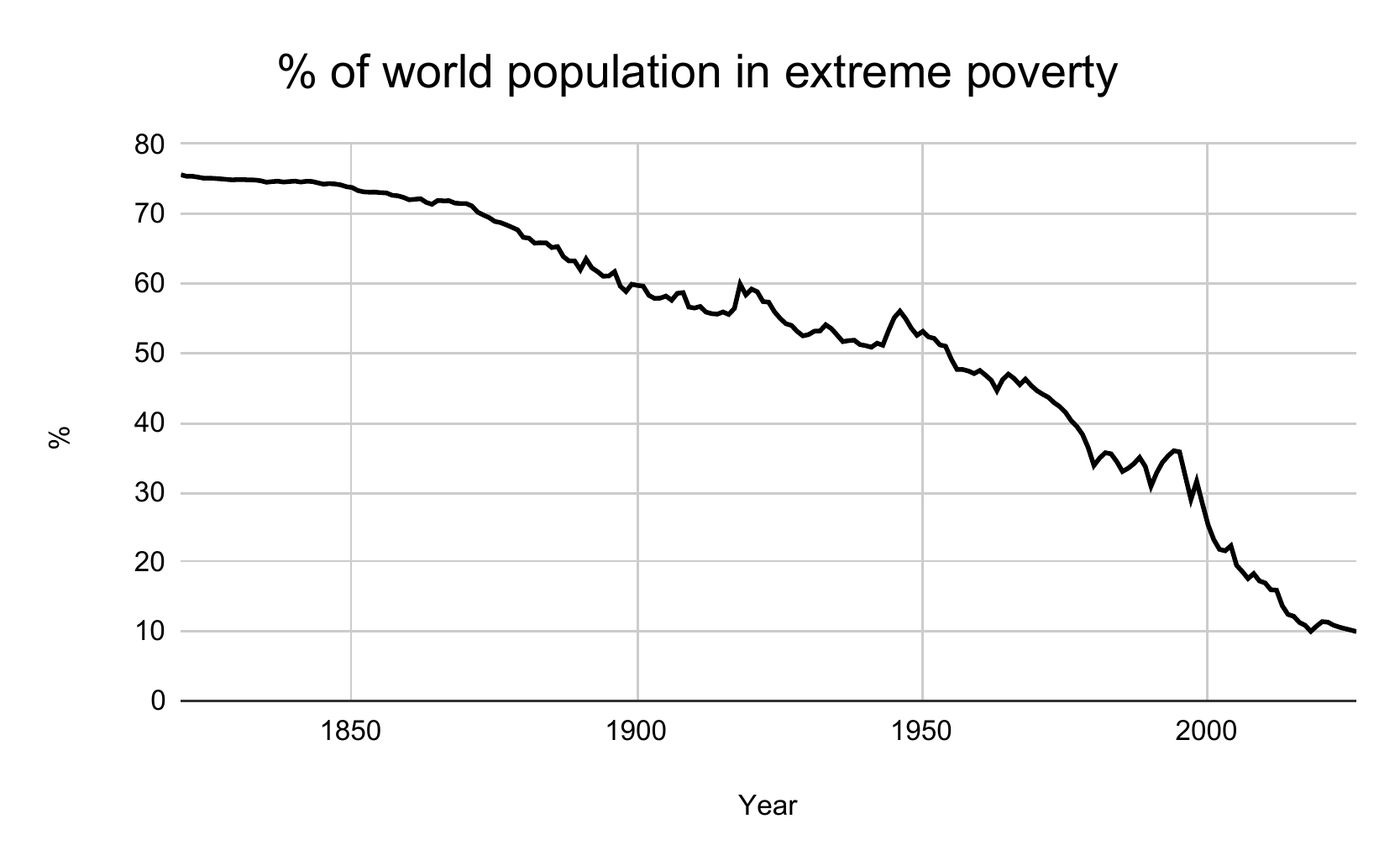
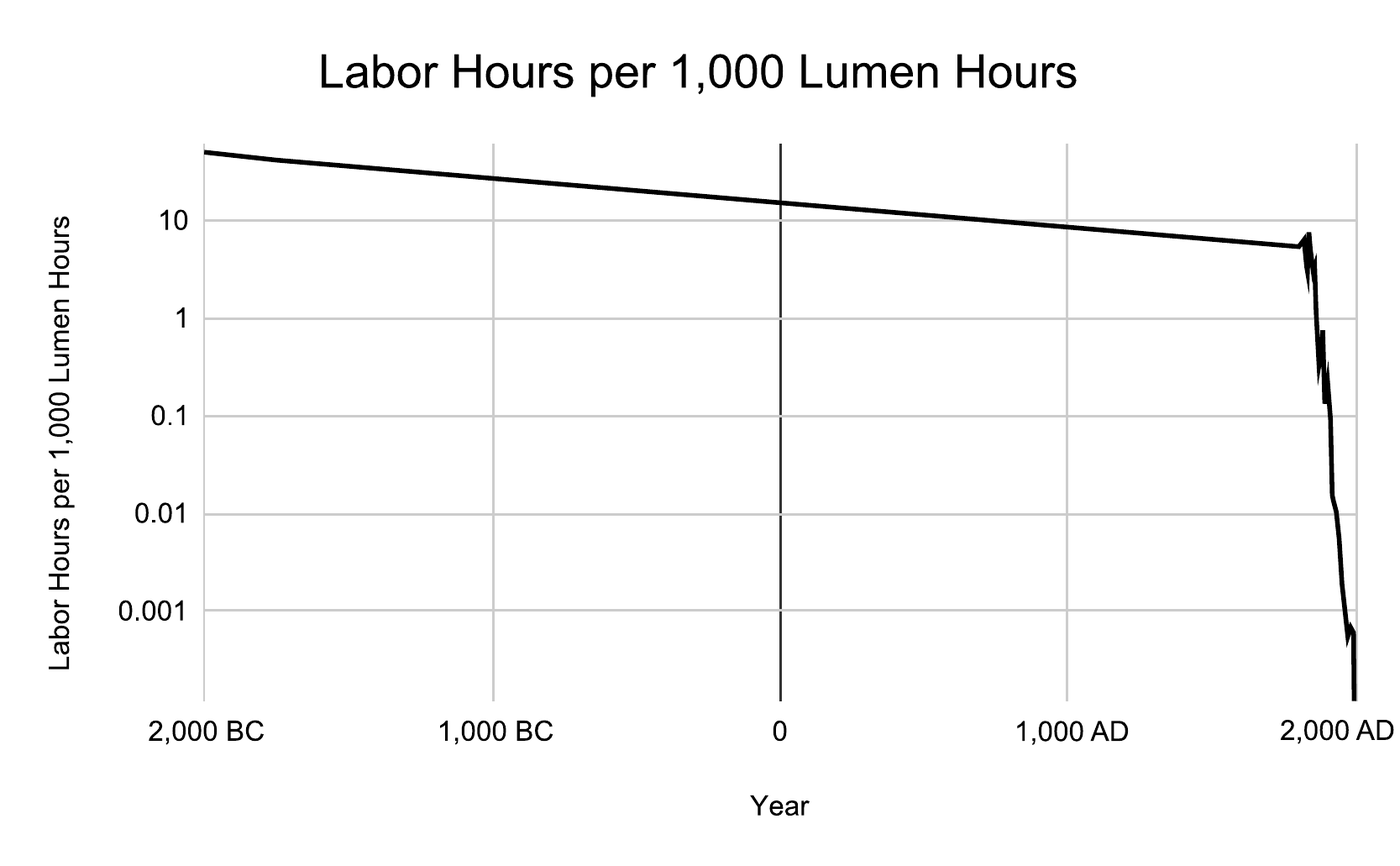
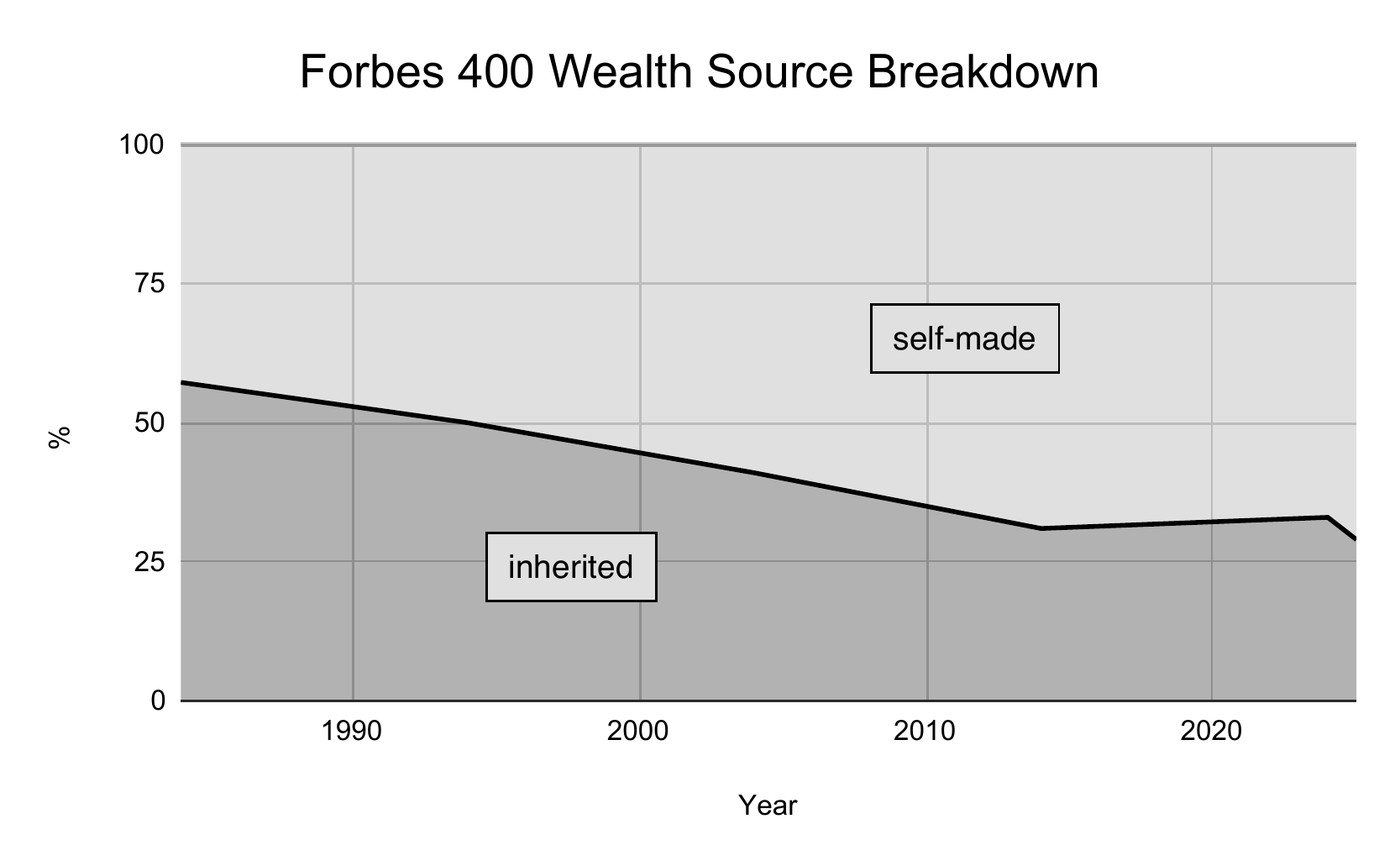
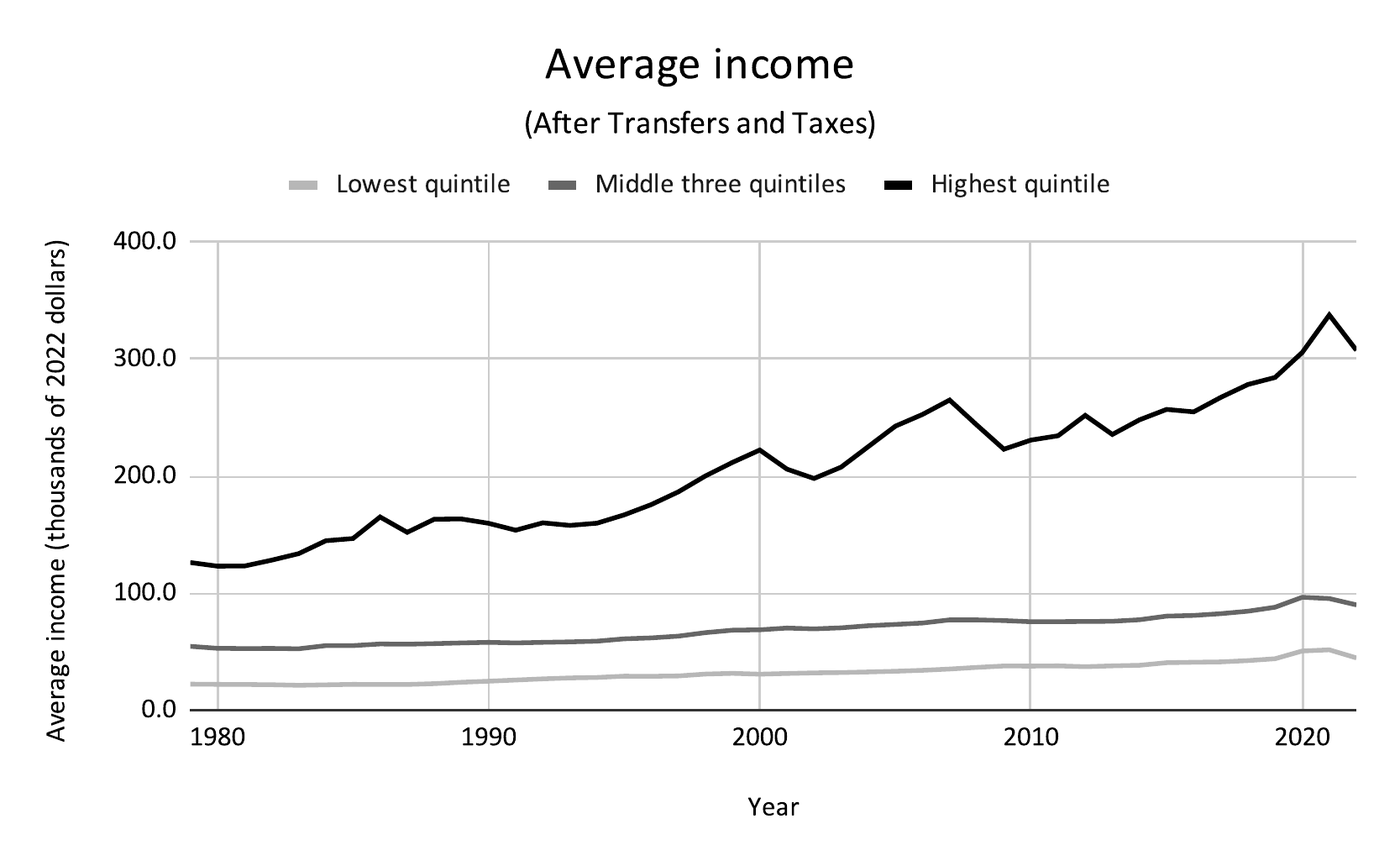
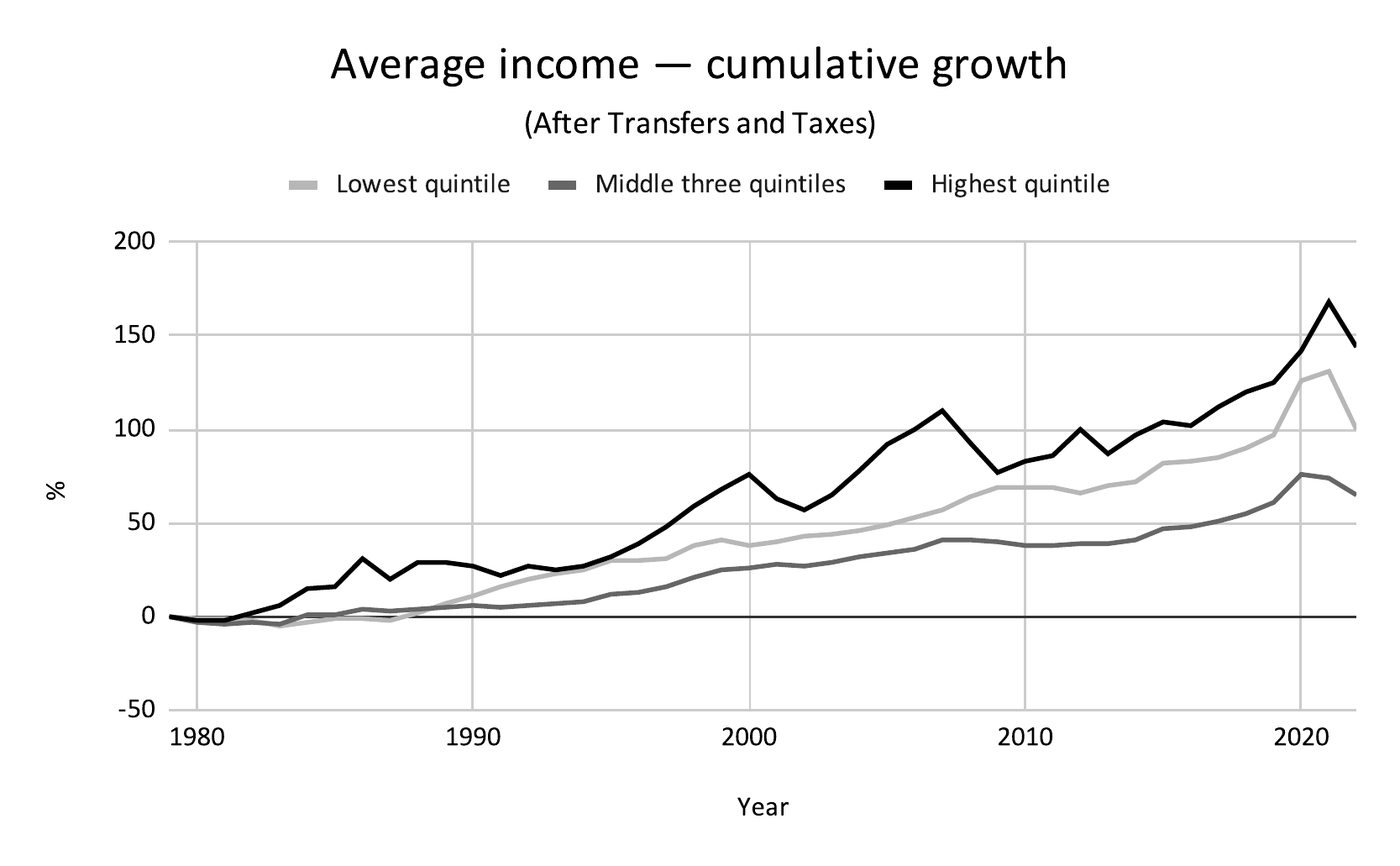
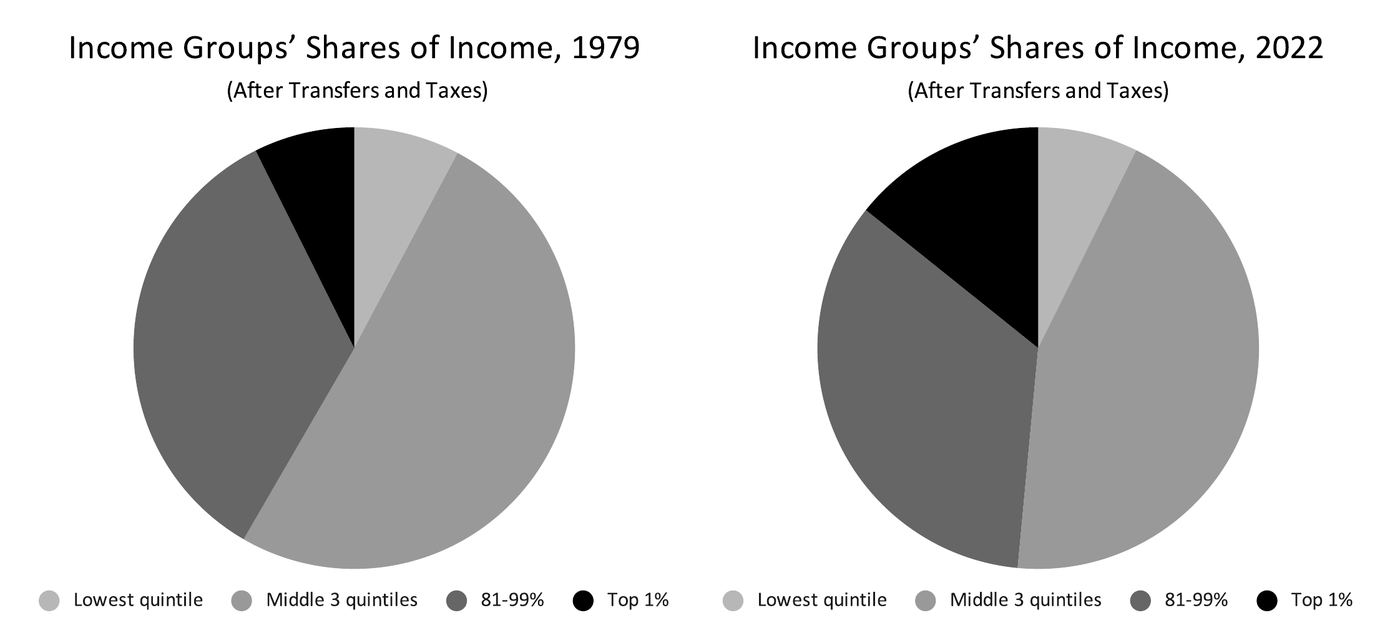
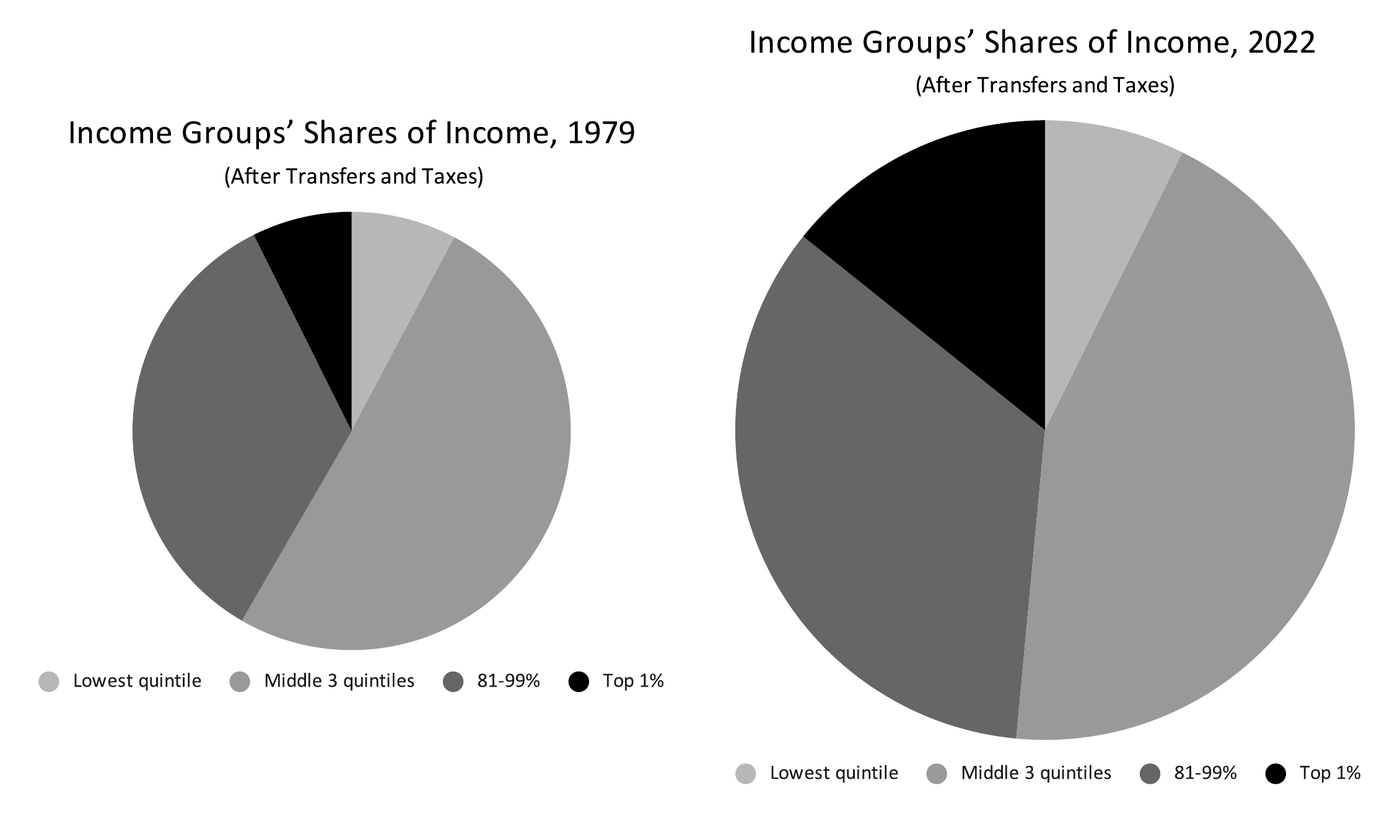
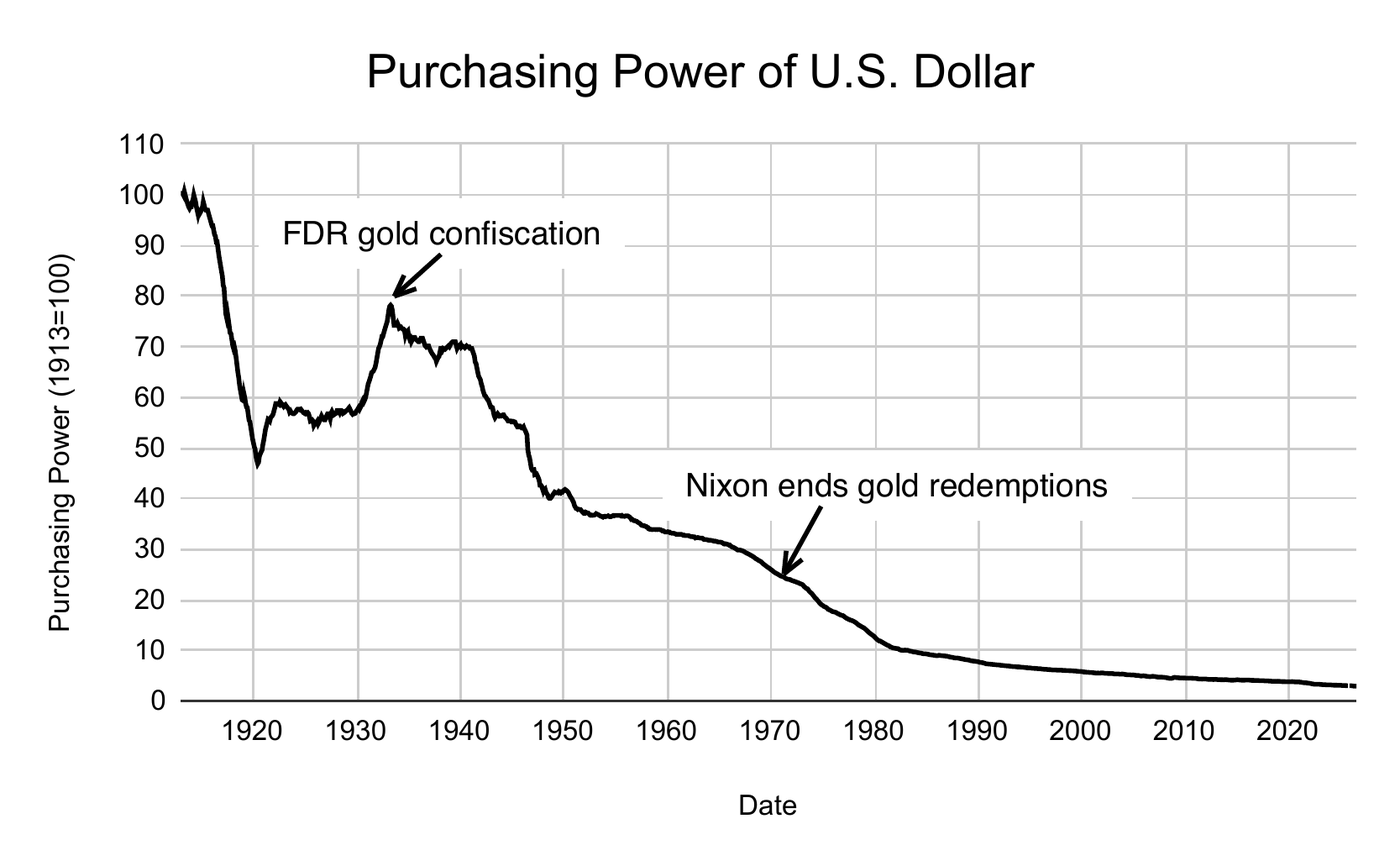
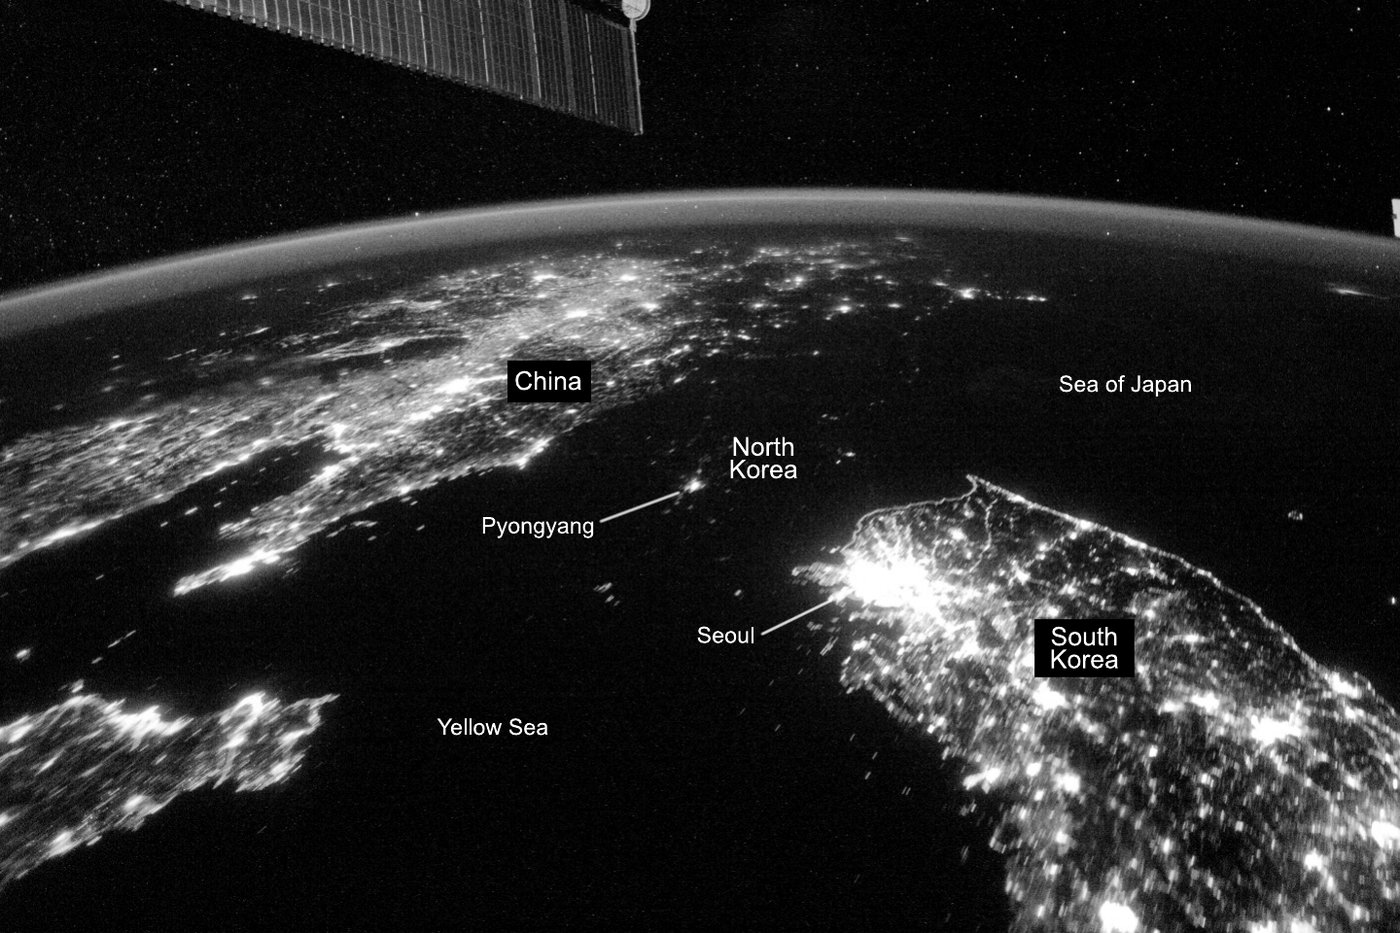
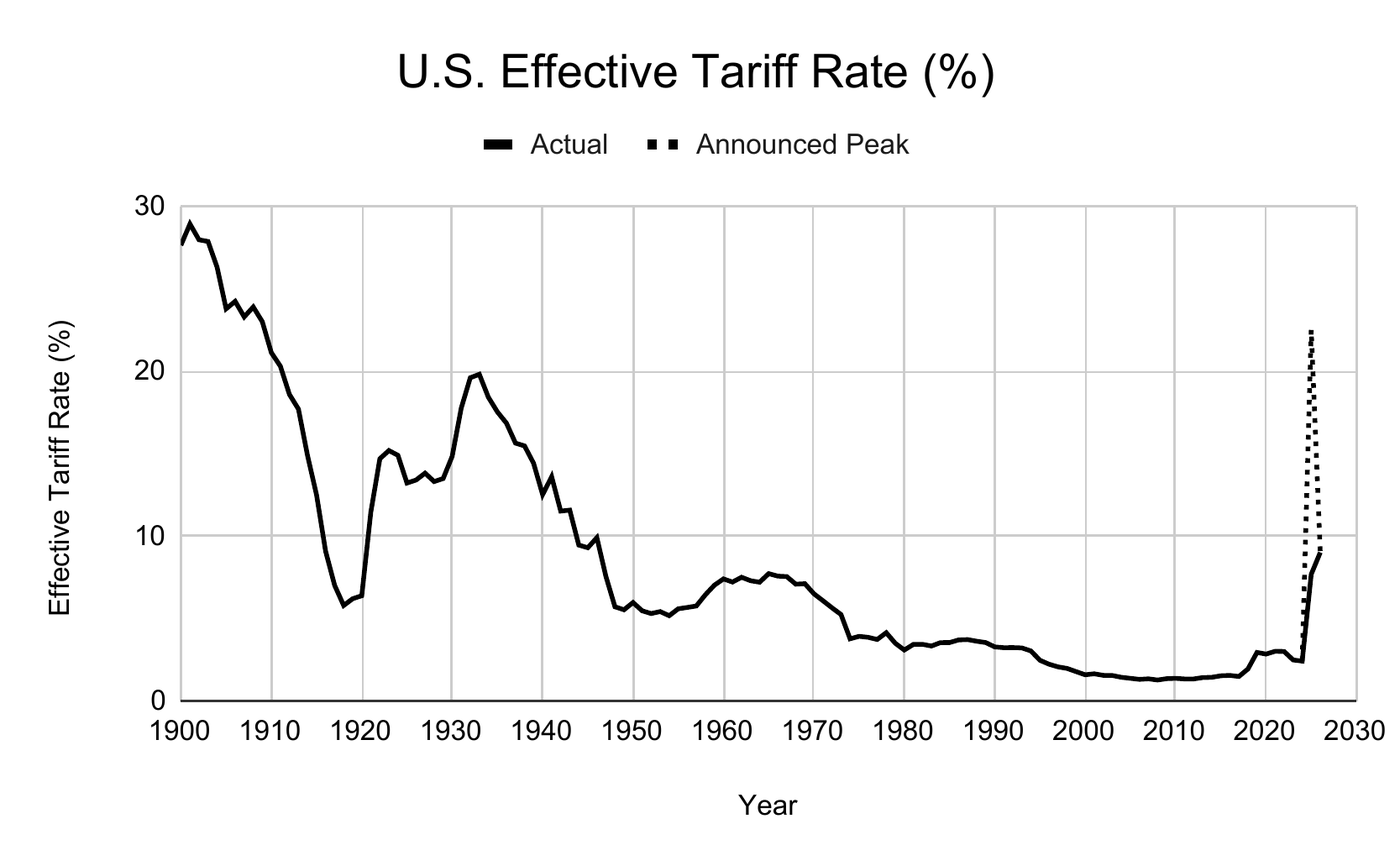
Figure 1. The line that never rose, and then did: estimated world GDP per capita from Year 1 to 2025. For all of recorded history the average human being lived near subsistence; around 1800, for the first time, the line begins to climb—and it has not stopped. Source: Our World in Data, from the Maddison Project Database 2023 (Bolt and van Zanden), the Maddison Database 2010, and Eurostat, OECD, IMF, and World Bank (2026). Per capita income takes the same shape.Figure 2. The share of humanity in extreme poverty, 1820 to 2026. Three in four at the start; one in ten at the end. The line joins two measures where they meet: 1820 to 2018 is Michalis Moatsos’s cost-of-basic-needs estimate, and 2019 onward is the World Bank’s $3.00-a-day line, which agrees with Moatsos within a point at the join; its last two years are the Bank’s projections. Sources: Moatsos (2021) and the World Bank Poverty and Inequality Platform (2026), both via Our World in Data.Figure 3. The price of light in the only honest currency—hours of human labor per 1,000 lumen-hours, from the campfire to the electric bulb. Source: William D. Nordhaus, “Do Real-Output and Real-Wage Measures Capture Reality? The History of Lighting Suggests Not” (1996). The vertical scale is logarithmic; each gridline is a tenth of the one above.Figure 4. The past does not devour the future: inherited versus self-made fortunes on the Forbes 400, 1984–2025. Source: Forbes self-made scores — decade breakdowns from Forbes’ 2014 analyses; 2024 and 2025 from the author’s tally of the published list scores.Figure 5. Real average income after transfers and taxes, by income group, 1979–2022, in thousands of 2022 dollars. Source: Congressional Budget Office, The Distribution of Household Income, 2022.Figure 6. The same data as cumulative growth: real average income after transfers and taxes, by income group, as a percentage change from 1979. Source: CBO, The Distribution of Household Income, 2022.Figure 7. Shares of income after transfers and taxes, 1979 and 2022, drawn as pies of equal size. Source: CBO, The Distribution of Household Income, 2022.Figure 8. The same two years, with each pie sized to the total it divides. Source: CBO, The Distribution of Household Income, 2022.Figure 9. The hockey stick’s dark twin: what remains of the 1913 dollar. Since the founding of the Federal Reserve, the dollar has lost roughly 97 percent of its purchasing power. Source: Bureau of Labor Statistics, Purchasing Power of the Consumer Dollar (CUUR0000SA0R), via FRED.Figure 10. One people, two ideas: the Korean peninsula at night. The border between the light and the darkness is not geography. Source: NASA Earth Observatory, “The Koreas at Night” (ISS astronaut photograph, January 30, 2014).Figure 11. The lesson, taught and untaught: customs duty revenue as a share of goods imported, 1900–2026. The 1930 spike deepened a depression; the long postwar descent accompanied a broad rise in living standards; and then, at the right edge, the turn back. The dotted line is the wall as announced in April 2025—22½ percent, the highest since 1909. The solid line is what was actually collected, which never approached it: exemptions, carve-outs, and finally the Supreme Court brought the rate in force to about nine percent. Figures are annual throughout, so the 1930s and the 2020s are measured the same way; every point is an outturn except 2026, which is the rate in force rather than revenue collected. Sources: The Budget Lab at Yale, from Historical Statistics of the United States Ea424–434, the Monthly Treasury Statement, and the Bureau of Economic Analysis; the 2025 figure is calculated from Treasury’s Monthly Treasury Statement over Bureau of Economic Analysis goods imports, and lands within a tenth of a point of the Budget Lab’s independently modeled estimate for the same year.
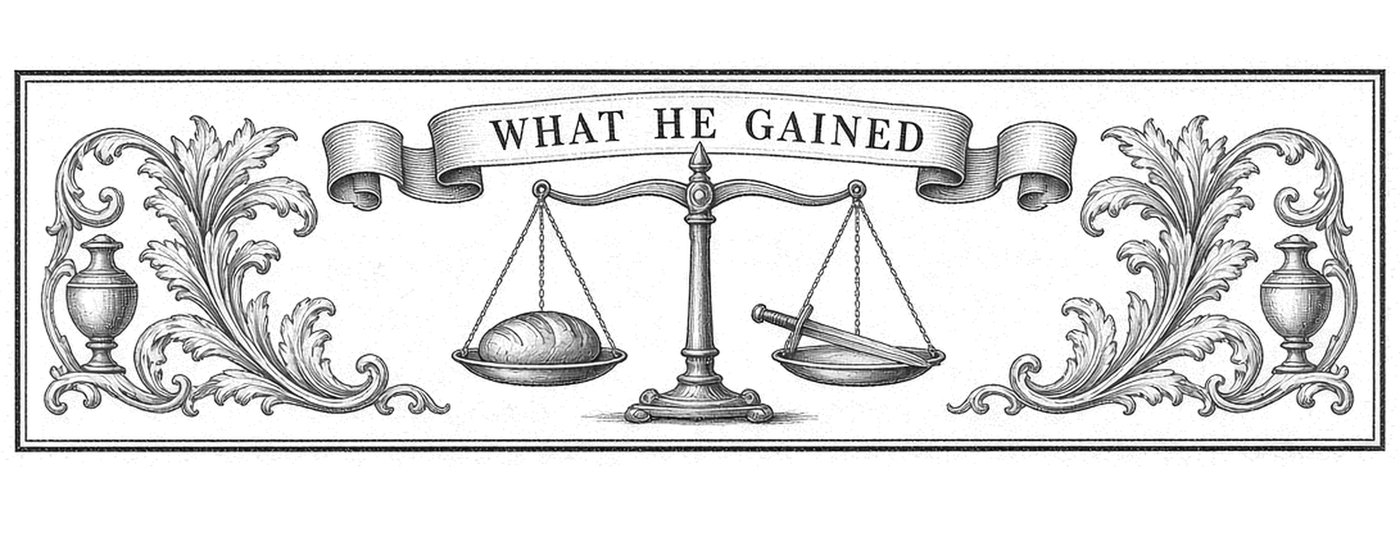
Chapter art
The banner that opens each chapter.
Prologue: The Oldest QuestionChapter 1: Games People PlayChapter 2: A World Made of TakingsChapter 3: The First SurplusChapter 4: Mercantilism: Zero-Sum as Official DoctrineChapter 5: The Idea That Broke the TrapChapter 6: Adam Smith and the Positive SumChapter 7: The Hockey StickChapter 8: Why Trade Is Not WarChapter 9: Marx and the Theory of ExploitationChapter 10: Piketty and the New Zero-SumChapter 11: The Psychology of the Fixed PieChapter 12: The SignalChapter 13: The Oldest PlunderChapter 14: The Ledger of FailureChapter 15: The Doctrine Never DiesChapter 16: Keeping the PlentyChapter 17: Harmed, and Not WrongedEpilogue: The Board